How I improved a WordPress website's start render time to under 1 second
Published: Sun Apr 26 2020Over the course of three months, I improved a WordPress website’s page load time from 5.52 to 1.40 seconds and brought it’s start rendering time to under 1 second. I learned a few things in the meantime and changed my perspective (albeit slightly) towards WordPress, and I have summed it all up here. I cannot link to the site yet, but hopefully you are still able to take value from my findings. I will include a link as soon as I can as your feedback would be fantastic because I am sure there is a lot I don’t know and more that can be done.
All measurements are taken on a simulated iPhone 8 running Chrome on a 4G LTE connection (Download: 12 Mbps, Upload: 12 Mbps, Latency: 70ms) as this was the average customer’s setup as determined from Google Analytics.
In 2019, a local travel startup approached me as they felt that their website was sluggish and they had concerns that this was leading to an increased bounce-rate and as a result, increased costs-per-acquisition on their ad campaigns. Their website was built using WordPress; a product I am not very familiar with, apart from the very basics; however I felt that it was a good opportunity to apply the knowledge on website performance on a completely different tech-stack and to see if it holds.
Measure
So before getting my hands dirty with the optimising, I set up a monitoring tool named SpeedCurve to allow me to collect metrics on the website performance and also to confirm whether there was a correlation between performance & bounce-rate.

Correlation between Page Load Time and Bounce Rate
Surely enough, the bounce rate was increasing as the page load time increased, and the median wasn’t too flattering at 5.52 seconds, meaning a large percentage of users (and paid traffic) was leaving the site before it finished loading. This confirmed that there was work to be done; however a stronger correlation was seen between the start render time (currently at 2.20s) and the bounce rate, which told me which metric to prioritise.
(The graphs in the images are taken using RUM (real user metrics) while the values used throughout the document are taken from lab tests as they provide a more consistent measurement since they are not susceptible to real-world variations such as device speed and connection.)

Correlation between Start Rendering Time and Bounce Rate
Implement
The first step I took was to label the different areas which each performance optimisation would be targeting; these were categorised under TTFB (time to first byte); start render time and load time as above (sorted by priority.)
TTFB was most likely going to be related to the server-side logic and/or hosting environment. Knowing that this was a WordPress website, the business logic on the backend was not computationally expensive and unlikely to be the cause; so we went straight to the DNS & hosting.
The website was hosted on BlueHost, a popular WordPress hosting provider; however for this client’s setup; its response times were abysmal. As I am familiar with AWS and have seen good results in the past, I created a copy of the website and hosted it on a micro EC2 instance for WordPress with NGINX and made this available on a sub-domain. The DNS was hosted on some strange combination of different services. This too was migrated onto AWS. These two simple changes resulted in an improvement of almost 1 second in TTFB. 🤯
(Disclaimer: I am not aware if BlueHost have/had a better performing package than the one which was being used)
As a result, our start rendering time has already dropped to 1.35s and now we’ll be up against the law of diminishing returns. By taking a quick glance at the output HTML, we agreed that there was still room for improvement. Over the course of the next couple of weeks, we deployed & validated the following:
- Reduced the number of different font requests by combining multiple font faces into a single request. Update: The font was eventually removed in favour of system fonts.
- Adopted a more aggressive caching strategy & integrated a CDN through W3 Total Cache plugin.
- Added resource hints to
prefetchfonts,dns-prefetchthird party domains andpreconnectto the CDN. Originally I attempted to use some WordPress plugins, however after trying a handful but with little success, I opted to add it manually to the PHP file responsible for creating the<head/> - Inlined critical CSS. This was eventually removed as the theme being used didn’t support this ‘out of the box’ and it would have quickly become unmaintainable.
- Reviewed the implementation of several tracking pixels & scripts. These were made to load async when possible and most related plugins were removed in favour of adding GTM tags.
- Deferred any non-render blocking scripts; as previously all scripts were being downloaded in the
<head/>)

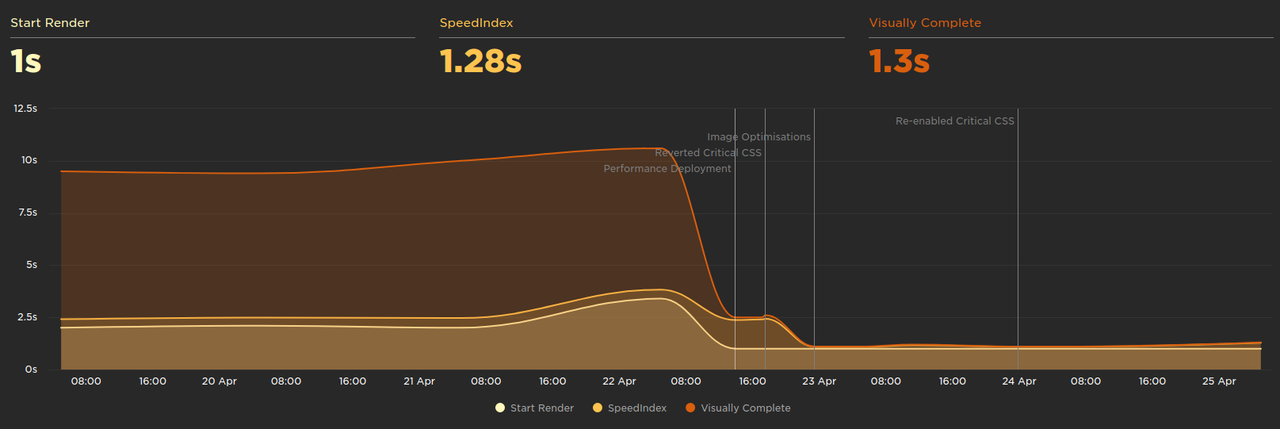
Start Render Timeline
The result of the above changes has brought the start render time to just under 1.0 seconds; which was our target. 🎉
(The figure above shows all performance improvements bundled as a single deployment because this is when we migrated the changes from a sub-domain we used for AB testing onto the production environment)
Before calling it a day, we wanted to improve our page load time; which at this point was still hovering at around 3.5 seconds. We identified a small number of low hanging fruit:
- Images were not optimised and often larger than required or in the wrong format (in most cases we optimised the images offline but added the Smush plugin too.)
- Images beneath the fold were downloaded immediately when they could be deferred through lazy-loading (we solved this through the AutoOptimize plugin.)
- The amount of JavaScript being shipped was plenty, especially considering the simplicity of the user journey. This was reduced from 892 kB to 371 kB (gzipped). This was achieved by removing unnecessary plugins & bits of JavaScript which are downloaded by the WordPress theme.
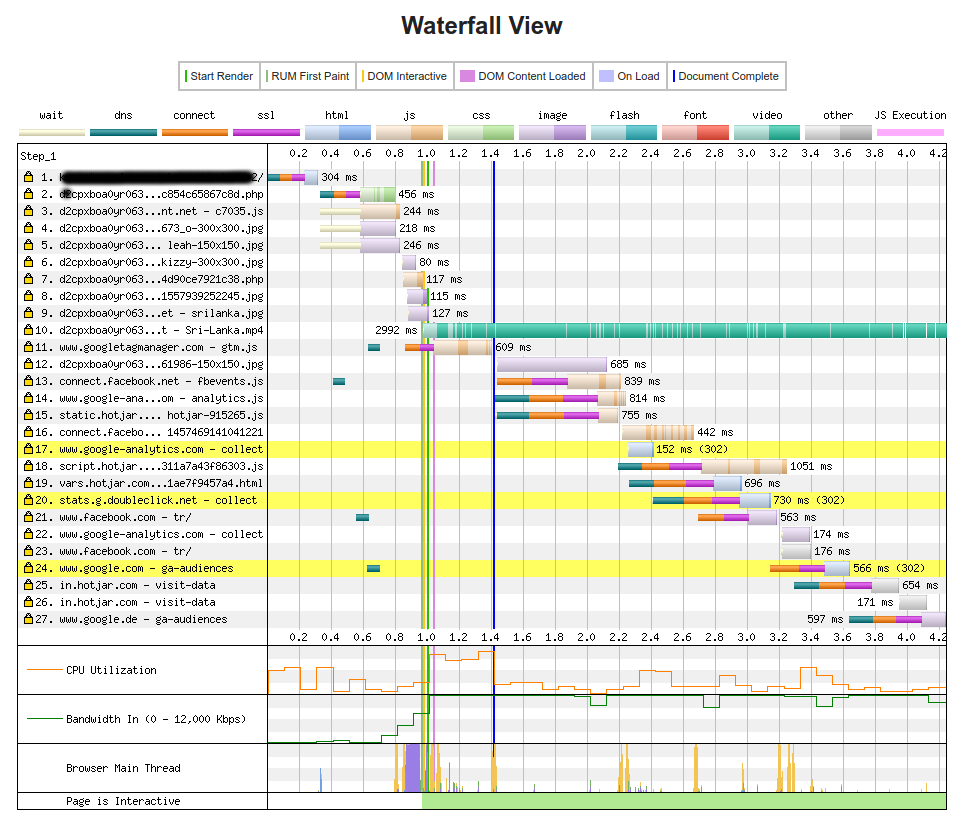
Once the above optimisations were done and deployed, the page load time was down to a satisfactory 1.38 seconds. Hoorah!

Web Page Test - Waterfall View
Conclusion
…and we’re done!
Admittedly, this project was comparatively simple, but keeping a WordPress website fast may be trickier than keeping a website in which you have access to the entire stack. A single plugin may easily add 50 kB of JavaScript in exchange for some additional feature or functionality and understanding which plugin is the culprit may feel like a game of Cluedo. When working on this project, it was important that each individual change was tested in isolation and that split testing was used to make sure that any fluctuations are not caused by variables outside our control. If you get lazy and stop measuring your website’s performance over time, you may very quickly find yourself with a mountain to climb. (bonus points for rhyming)
Latest Updates
- On writingThu Jun 26 2025
- Adding a CrUX Vis shortcut to Chrome's address barTue Apr 15 2025
- Contributing to the Web Almanac 2024 Performance chapterMon Nov 25 2024
- Improving Largest Contentful Paint on slower devicesSat Mar 09 2024
- Devfest 2023, MaltaWed Dec 06 2023