First Important Paint - Developing a custom metric
Published: Sat Jun 10 2023Updated: Monday Nov 27 2023 | This article is also available in Japanese.
In May 2020, Google proposed a set of user-centric metrics that serve to describe a website’s performance. These are known as the Core Web Vitals (CWV) and include:
- Largest Contentful Paint (LCP): The time it takes to paint the largest element in the viewport.
- First Input Delay (FID): The delay in responding to the first user input. Soon to be replaced with Interaction to Next Paint (INP).
- Cumulative Layout Shift (CLS): A measure of how much the page content shifts.
The CWVs aim to simplify the many performance metrics available and allow you to prioritize the metrics that matter the most. This abstraction has worked very well. In the years following the CWV announcement, website owners and service providers have invested in web performance, improving the user experience for users all across the web.
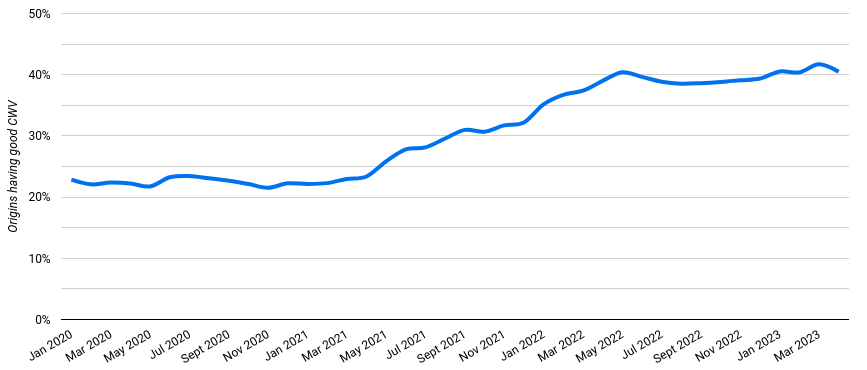
As shown in the chart above extracted from cwvtech.report, the number of websites passing the CWV thresholds has increased from 22% to 40%.
The role of custom metrics
Custom metrics allow you to extend the set of measures already available in the browser with your own measures that might describe your website’s user experience better than the default metrics. For example, LCP assumes that the largest element is also the most important one. This may be true for some websites but not for others.
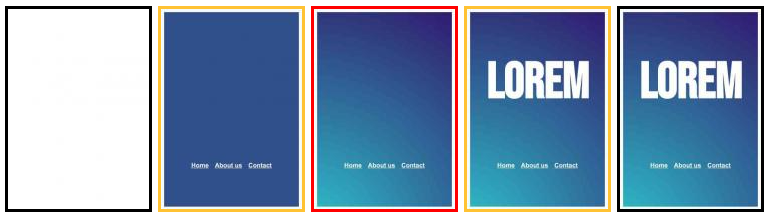
In the filmstrip above, the LCP element is the blue gradient background image as highlighted in the frame with the red border. While arguably, the most important element is the page title “Lorem” which is rendered in the next frame. This might be an exaggerated example, but the same problem exists if the important element is a grid or table, or if the background is a <video> element with a poster image.
Element Timing API
Similarly to LCP, the Element Timing API allows you to measure the time a DOM element is rendered on the page. However, unlike LCP, Element Timing allows the developer to choose which element (or elements) to measure. Element Timing is configured by adding the elementtiming attribute to an element.
One limitation of Element Timing is that it is only supported in Chromium-based browsers. Additionally, it is only supported on a limited subset of elements.
User Timing API
The User Timing API is an API that allows you to set marks and measures at specific points in time. For example, this could be once an element is painted onto the page or once an important task has been executed.
// record the time before the task
performance.mark('doSomething:start');
await doSomething();

// record the time after the task has completed
performance.mark('doSomething:end');

// measure the difference between :start and :end
performance.measure('doSomething', 'doSomething:start', 'doSomething:end');
Real user metrics and lab tests
When developing a custom metric, the first question to ask is whether you want to measure this metric from real users on real devices or if it will only be collected from lab tests. Both types of measures can provide you with value, albeit slightly differently.
Real user metrics (RUM) give you a full spectrum of the user experience. Instead of a single score, you will have a range of values that reflect the different users and experiences. For example, users at the 90th percentile may have a terrible experience while the median user has a good one. Understanding the different factors that influence your metrics—for example, geographical location, browser, or device—will allow you to better optimize your website for your users. On the downside, implementing a RUM solution may be expensive or complex.
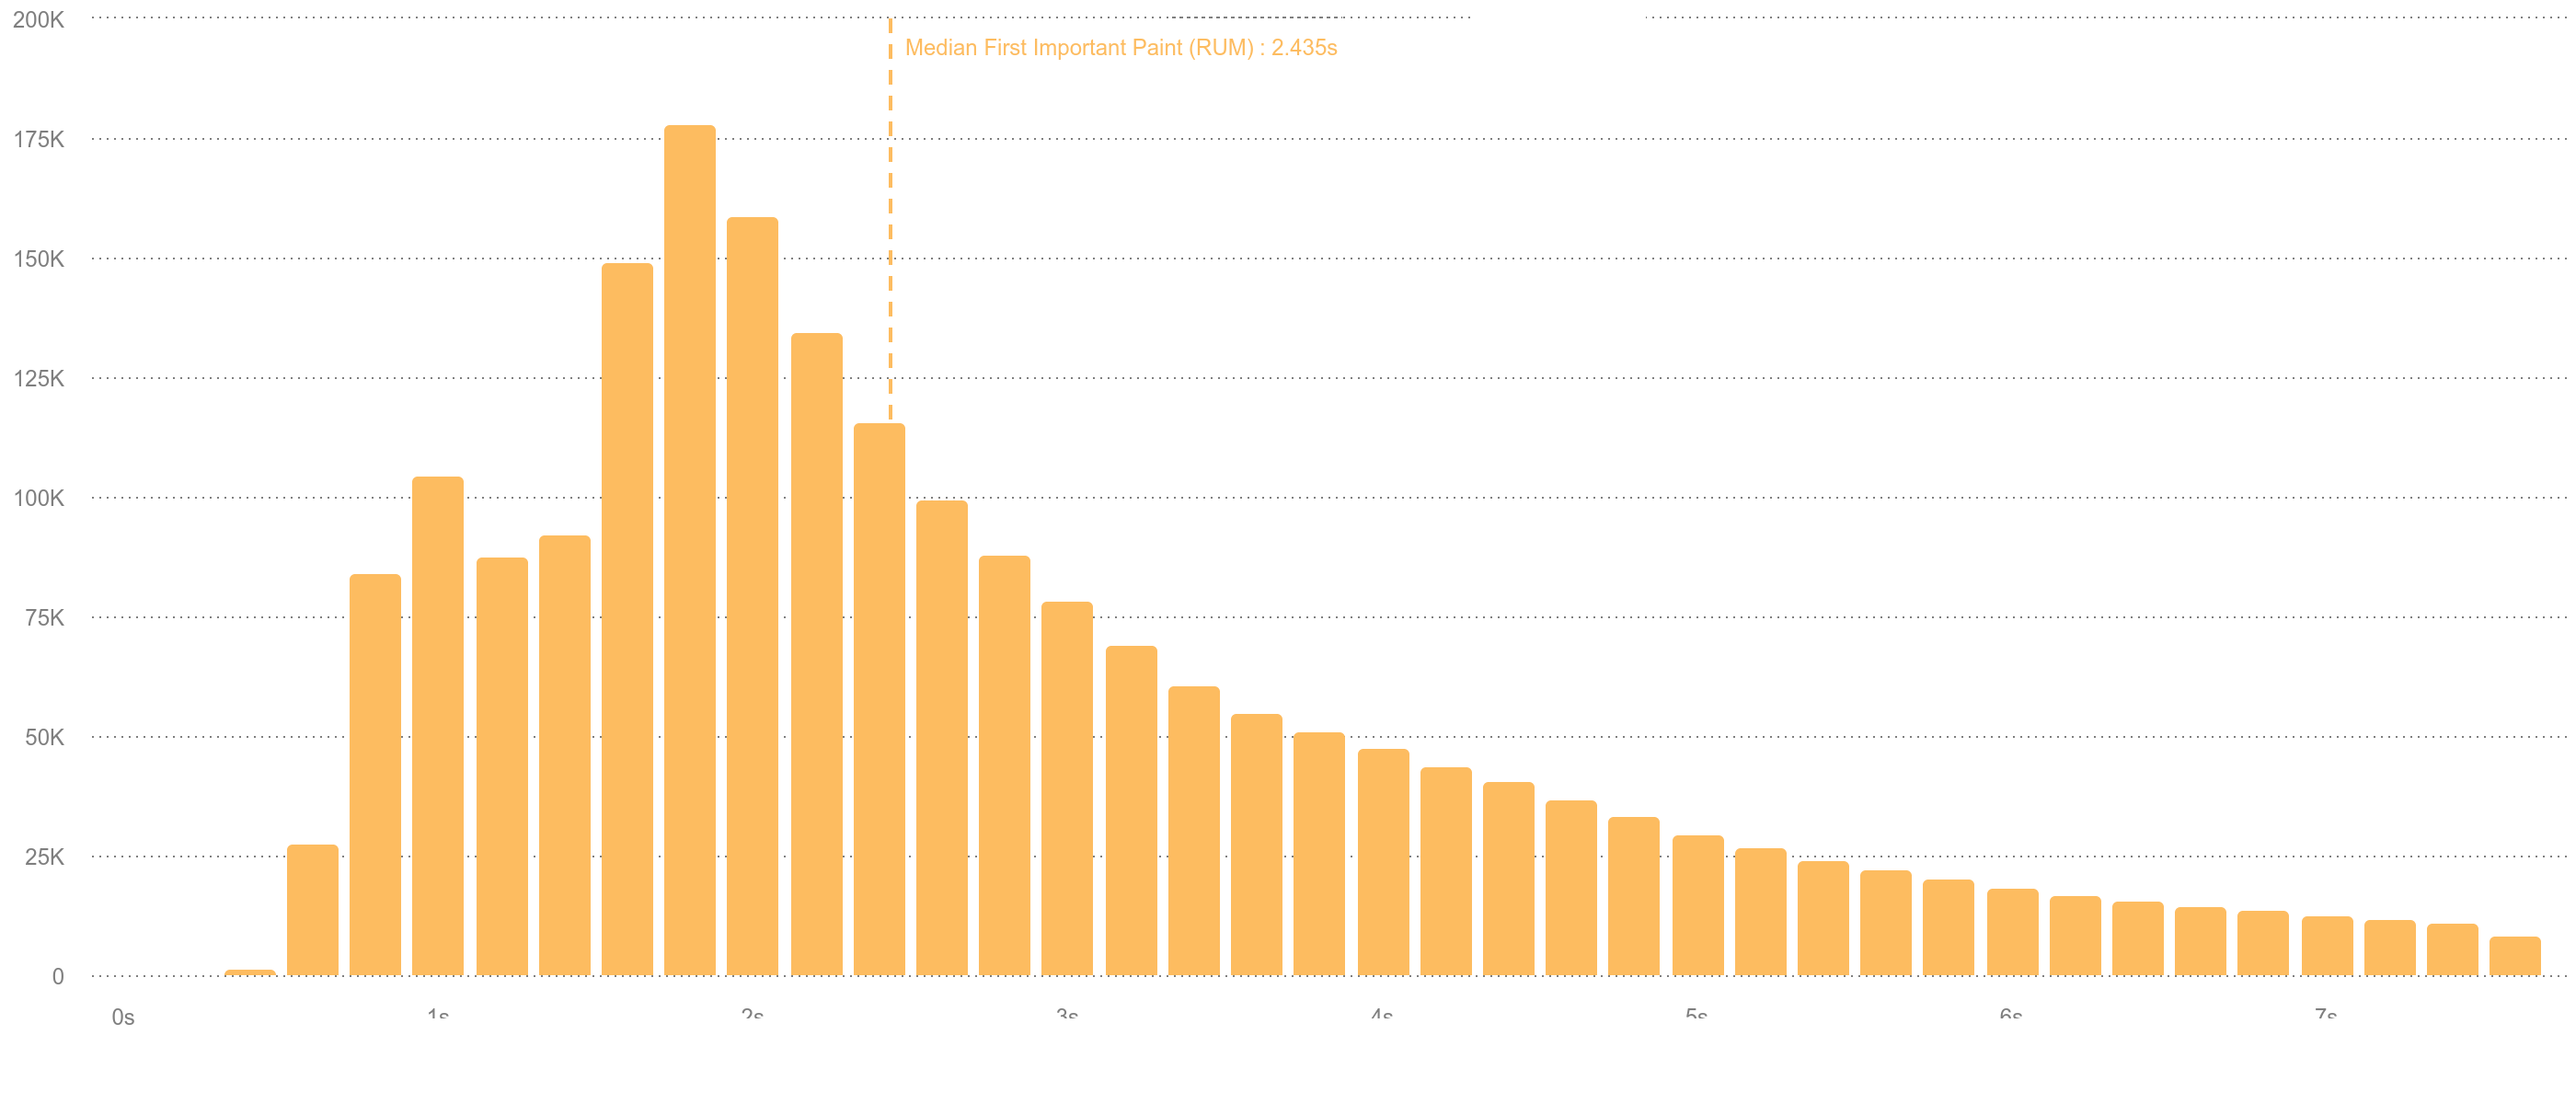
The screenshot above is taken from SpeedCurve and shows a distribution of different user experiences.
Lab tests run in a controlled environment. You might be able to configure several parameters, such as connection speed, device, and location from where the tests would run. The test result will be a report detailing the different metrics collected from your page.
Lab tests are highly effective at debugging issues. Running lab tests at regular intervals allows you to compare your page’s performance over time and identify regression. My favorite tool for running lab tests is the amazing WebPageTest.
Properties of a good metric
When presenting LCP in 2020, Paul Irish described a list of 8 properties that a good metric should observe—there is also a slight variation documented in the Chromium source code:
- Representative: Correlates with user experience and business value.
- Interpretable: The metric and its value are easy to understand.
- Accurate: How closely the metric measures what it is expected to measure.
- Simple: The method it is computed is not complex.
- Orthogonal: It should not be measuring something that is already being measured by other metrics.
- Stable: There shouldn’t be a lot of variance between runs.
- Elastic: A small change in the input results in a small change in the metric.
- Correlates: The metric should correlate well with other metrics and between lab/field tests.
Observer Effect
Another important property of a good metric is that it does not influence the test itself. In science, the Observer effect is described as the disturbance of a test by the act of observation. If measuring a custom metric measurably slows down the page, then the metric is not a good one.
First Important Paint
First Important Paint (FIP) is a custom metric that was developed to measure the time it takes to paint the first annotated HTML element onto the page.
The need for this metric arose because the LCP element did not always correspond to the user experience. Additionally, pages were composed of different components—often built by developers on different teams. By annotating the element—instead of the page—the developers creating the component do not need to know on which page the component is being used as it would automatically be treated as an FIP candidate.
(It also comes with a three-letter acronym so you know it’s legit 😛)
Is FIP a good metric?
First Important Paint can be measured both in the field and in the lab. To determine if FIP is a good metric, I ran some lab tests and collected data from two production websites in unrelated markets.
Representative
To test if FIP is representative, I prepared some lab tests with screenshots from different pages and devices and asked colleagues with no knowledge of the metric to tell me in which frame they would consider the most important element to be painted. We used this data to decide which components should be treated as important and to assess whether LCP was already representing this information.
Interpretable
The First Important Paint is easy to understand and is measured in milliseconds.
Accurate
To measure the accuracy of the custom metric, I ran some lab tests where the FIP element was also the LCP element. This means that FIP should record a similar value as LCP. For text elements, I used the Element Timing API instead of LCP.
The tests were executed for image and text elements using 3 different connection speeds. For native connections, the FIP differed from the LCP by 50ms. For Regular 4G and Regular 3G connections, the difference between FIP and LCP elements increased to 200ms and 1000ms respectively.
While the results may appear underwhelming the measurements were consistent and the difference between FIP and LCP or Element Timing did not vary greatly between one test and another. For example, it would have been more concerning if one test registered an FIP that is 50ms faster than LCP and the successive test registers an FIP that is 50ms slower than LCP.
The reasons for the inaccuracy are various and are limitations in how the metric is computed.
Simple
The code for measuring and computing FIP is simple and can easily be debugged or modified if needed.
Orthogonal
FIP is a custom metric that aims to measure the most important element on the page. In some cases, this might be the same as the largest element, in which case it would overlap with LCP.
Stable
To measure the stability of First Important Paint, I ran lab tests on 3 different connection speeds.
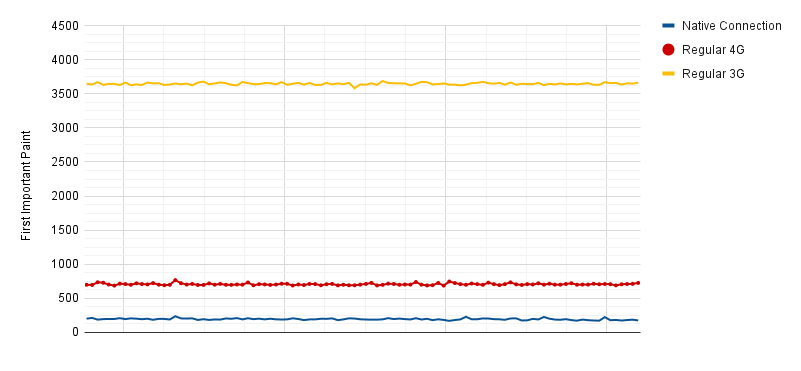
As shown in the chart above, all connections experienced very little variation between one test and another.
Elastic
A metric is elastic if it responds proportionately to a change in the user experience. To test if FIP is elastic, I created a demo to serve as a baseline and a variation of this page that self-hosts and preloads the font files. It is expected that the user experience should improve as the title is rendered earlier—and as a result, FIP should also improve.
One of the earlier iterations of FIP did not record any improvements after this change. This helped me identify a flaw in the metric as FIP was recording the time a text element was added to the DOM but did not consider cases when the web fonts have not yet been downloaded.
After this issue was resolved we can see a small and proportional improvement in FIP that matches the improved user experience.
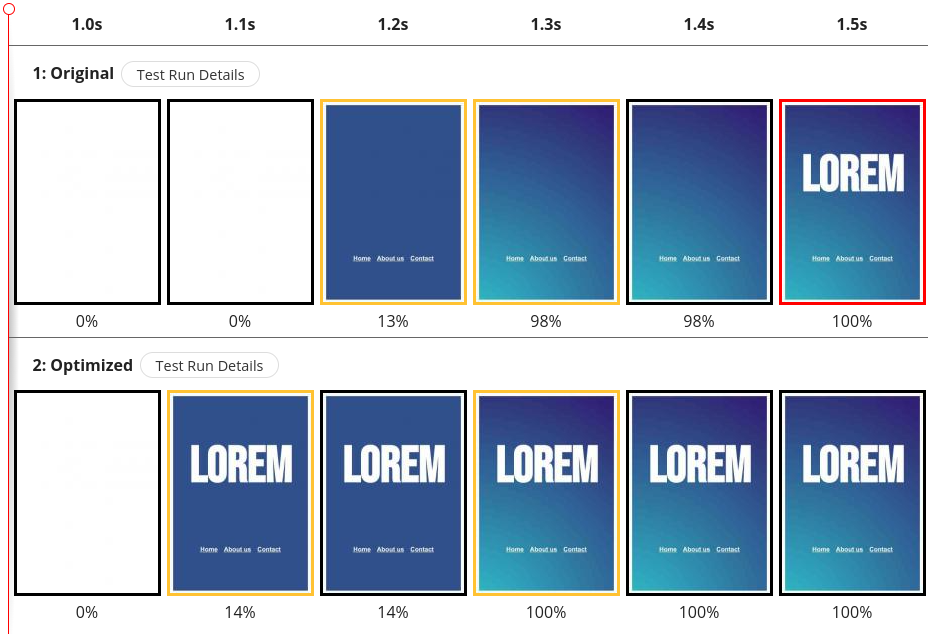
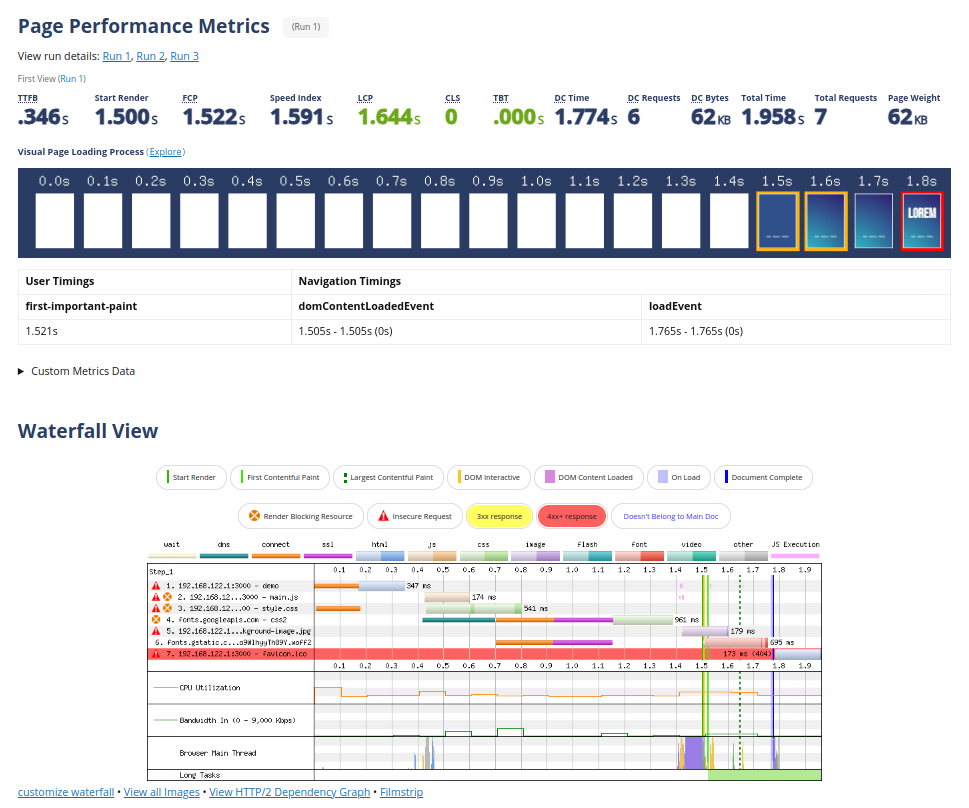
In the comparison above, the Original test reported an LCP of 1.315s and FIP of 1.470s. The Optimized test—which included the fixes above—reported an LCP of 1.305s and an improved FIP of 1.188s. This coincides with the user experience, where the second test has a much-improved experience.
Correlates
To check if FIP correlates with other metrics, I used the same tests described earlier in Accuracy. I plotted FIP against LCP in a scatter plot and calculated the coefficient of determination. For the two metrics to correlate, they do not need to have the same value, but an increase in LCP should result in a proportional increase in FIP and vice-versa.
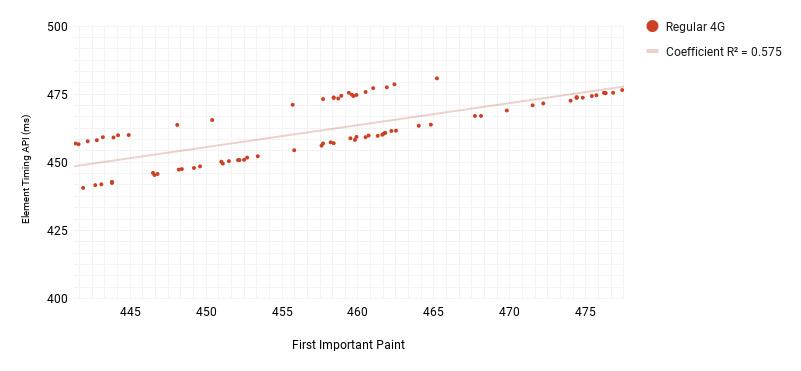
For text elements, Regular 4G recorded a strong correlation while Regular 3G did not register an equally strong correlation.
Using real user data available in SpeedCurve we can also check if FIP correlates to business metrics.
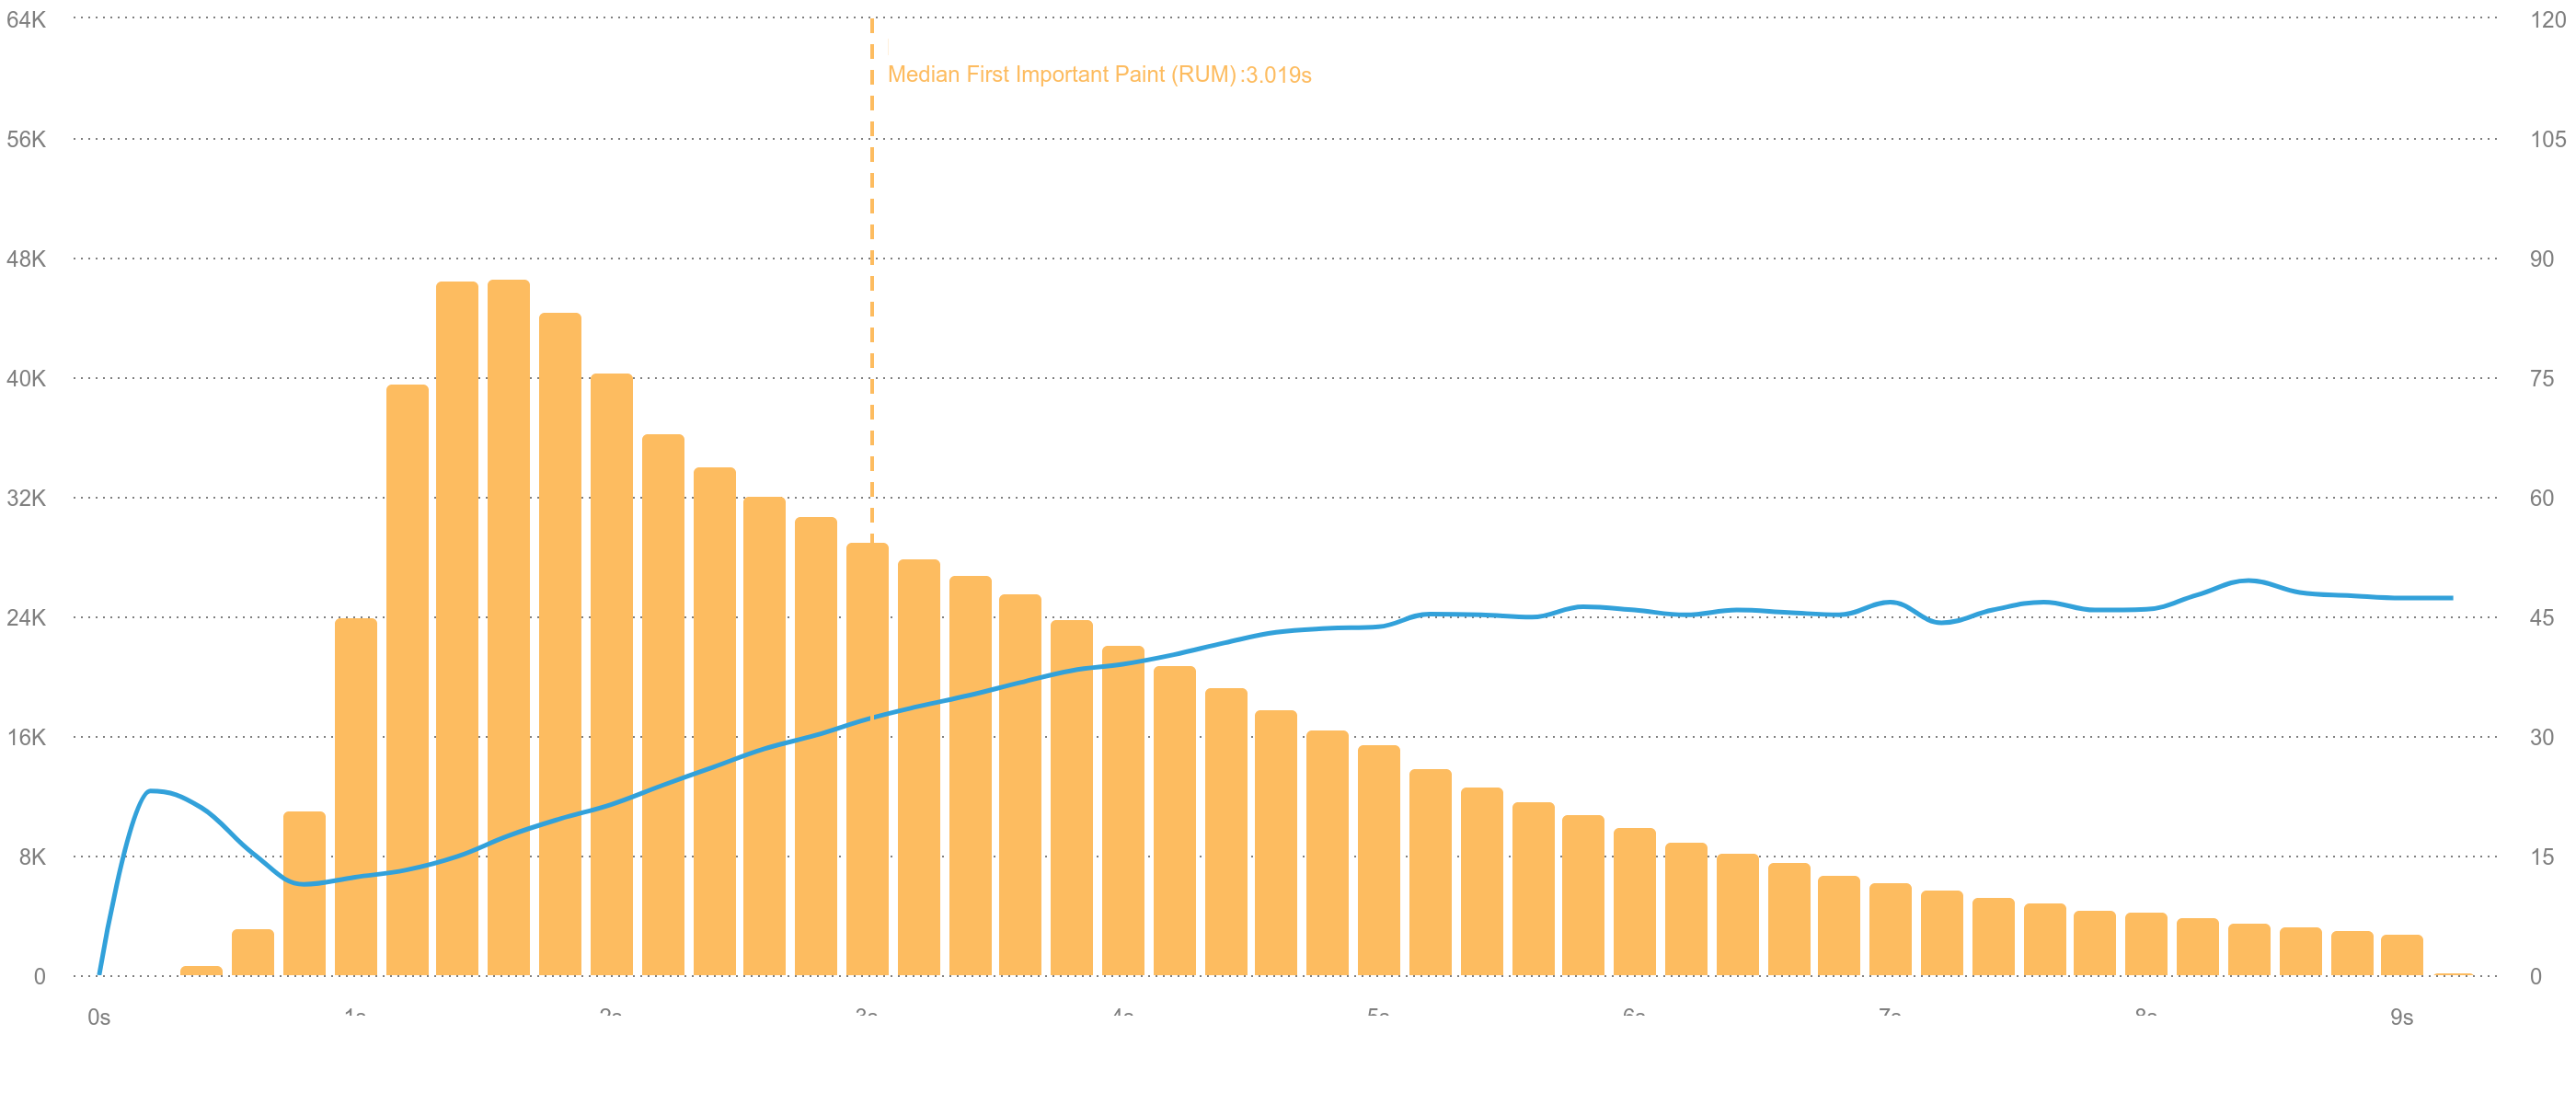
The chart above is extracted from SpeedCurve and shows a positive correlation between the page’s bounce rate (blue line) and FIP—as FIP increases so does the bounce rate.
Observer Effect
Finally, we want to confirm that the metric does not influence the performance of the page being tested. We ran some tests that contained the measurement and the same tests that do not use the measurement—but include a similarly sized render-blocking script.
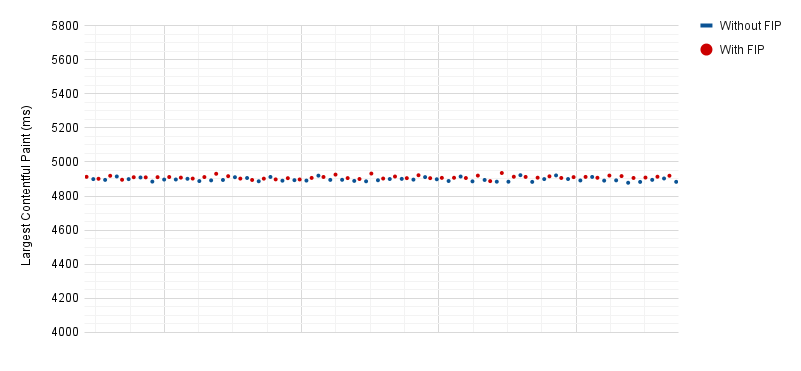
As shown in the chart above, the LCP element did not vary between the two sets of tests. In the future, we may also want to extend this test to include JavaScript long tasks in addition to LCP.
Conclusion
The goal of this document is not to promote FIP, but to initiate an internal process of metric reviews. Understanding the scope of the Core Web Vitals and what makes a good custom metric allows us to be critical of our metrics and improve them.
So, is First Important Paint a good metric? It has its limitations and your mileage may vary, but for us, it currently serves an important purpose. I do hope we can improve it and add new custom metrics that describe other aspects of the user experience too.
Thank you for reading. I’m always eager to learn, so feedback and questions are welcome.
Latest Updates
- Improving Largest Contentful Paint on slower devicesSat Mar 09 2024
- Learn Performance course on web.devWed Nov 01 2023
- Setting up a Private WebPageTest instanceMon Jun 26 2023
- First Important Paint - Developing a custom metricSat Jun 10 2023
- Web Performance AuditWed Jun 07 2023