Interaction to Next Paint
Published: Thu Jun 16 2022Updated: Friday Feb 2 2024
In May 2022, Google added Time to First Byte (TTFB) and Interaction to Next Paint (INP) to their CrUX report. INP measures a website’s responsiveness and will replace First Input Delay (FID) as a Core Web Vital on March 12th, 2024.
Let’s take a look at what Interaction to Next Paint is and how can you prepare your website to have a good INP.
First Input Delay
Before looking at INP, let’s review First Input Delay, the Core Web Vital currently used to measure responsiveness to user interaction. FID measures the delay it takes the browser to begin processing the first interaction on a page.
In single-threaded JavaScript, if the main thread is busy processing a task, any user input is delayed until the call stack is clear and all tasks have been completed.
An example of poor responsiveness. The user key events do not update the screen until a long task has been completed and all characters are added at once.
FID is directly correlated with JavaScript long tasks. The more long tasks on your website, the more likely that the user input will be delayed as the browser must wait for the current long task to complete before processing input.

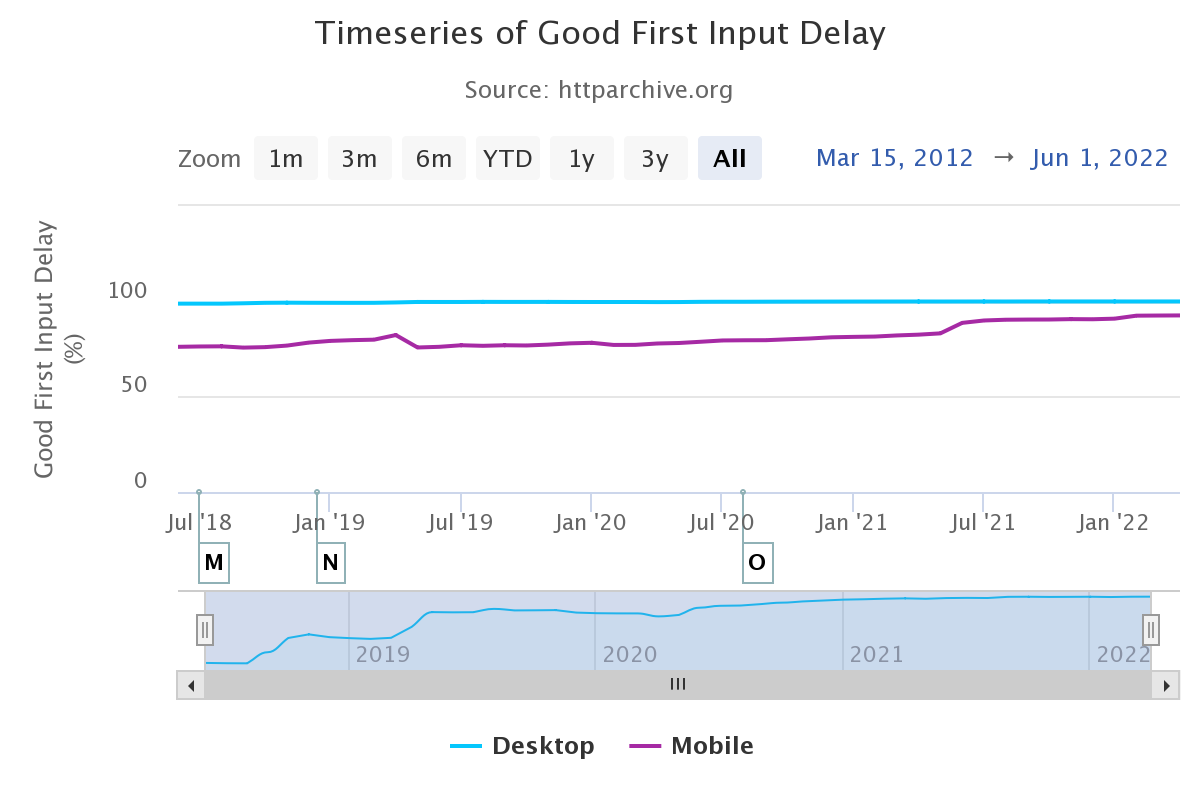
The number of websites achieving a good FID score has increased from 72.1% of origins in 2018 to 92.5% of origins in May 2022. FID on desktop was always > 98%.
Interaction to Next Paint
INP aims to build on FID but considers the responsiveness of all user inputs. It also captures the entire duration of the interaction, until the next frame is painted onto the screen. Check out this demo to get a feel of how frustrating a high INP could be.
What is an interaction?
An interaction is one of the following:
- Clicking or tapping on an interactive element, such as a button or checkbox.
- Pressing a key, including text input fields.
It does not include hover or scroll events.
How is an interaction’s duration measured?
The phases of a single interaction. The input delay occurs from the time an input is received and may be caused by factors such as blocking tasks on the main thread. The processing time is the time it takes for the interaction’s event handlers to execute. When execution finishes, we then enter the presentation delay, which is the time it takes to render and paint the next frame. Source: https://web.dev/inp/
An interaction consists of three phases, the input delay, the processing time and the presentation delay. The duration of an interaction as measured by INP is the sum of the time for all three phases. In simpler words, it is the time it takes from when the user interacts with an element or input until the next frame is painted on the screen. This could be any visual cue that the user input has been received, such as displaying the character in a textbox or displaying a loading animation after clicking a button.
What is a good INP?
In most cases, INP measures the worst interaction on your page. For highly interactive pages with more than 50 interactions, then INP will pick the 98th percentile. A good INP is one under 200 milliseconds, while a poor INP is one over 500ms. Anything in between means that your page needs improvement.
Why is INP important?
Even if Google does not add INP as a Core Web Vital, INP is descriptive of your user’s experience on your website. Having a good INP means that your website responds quickly to user input and provides your users with a delightful experience.

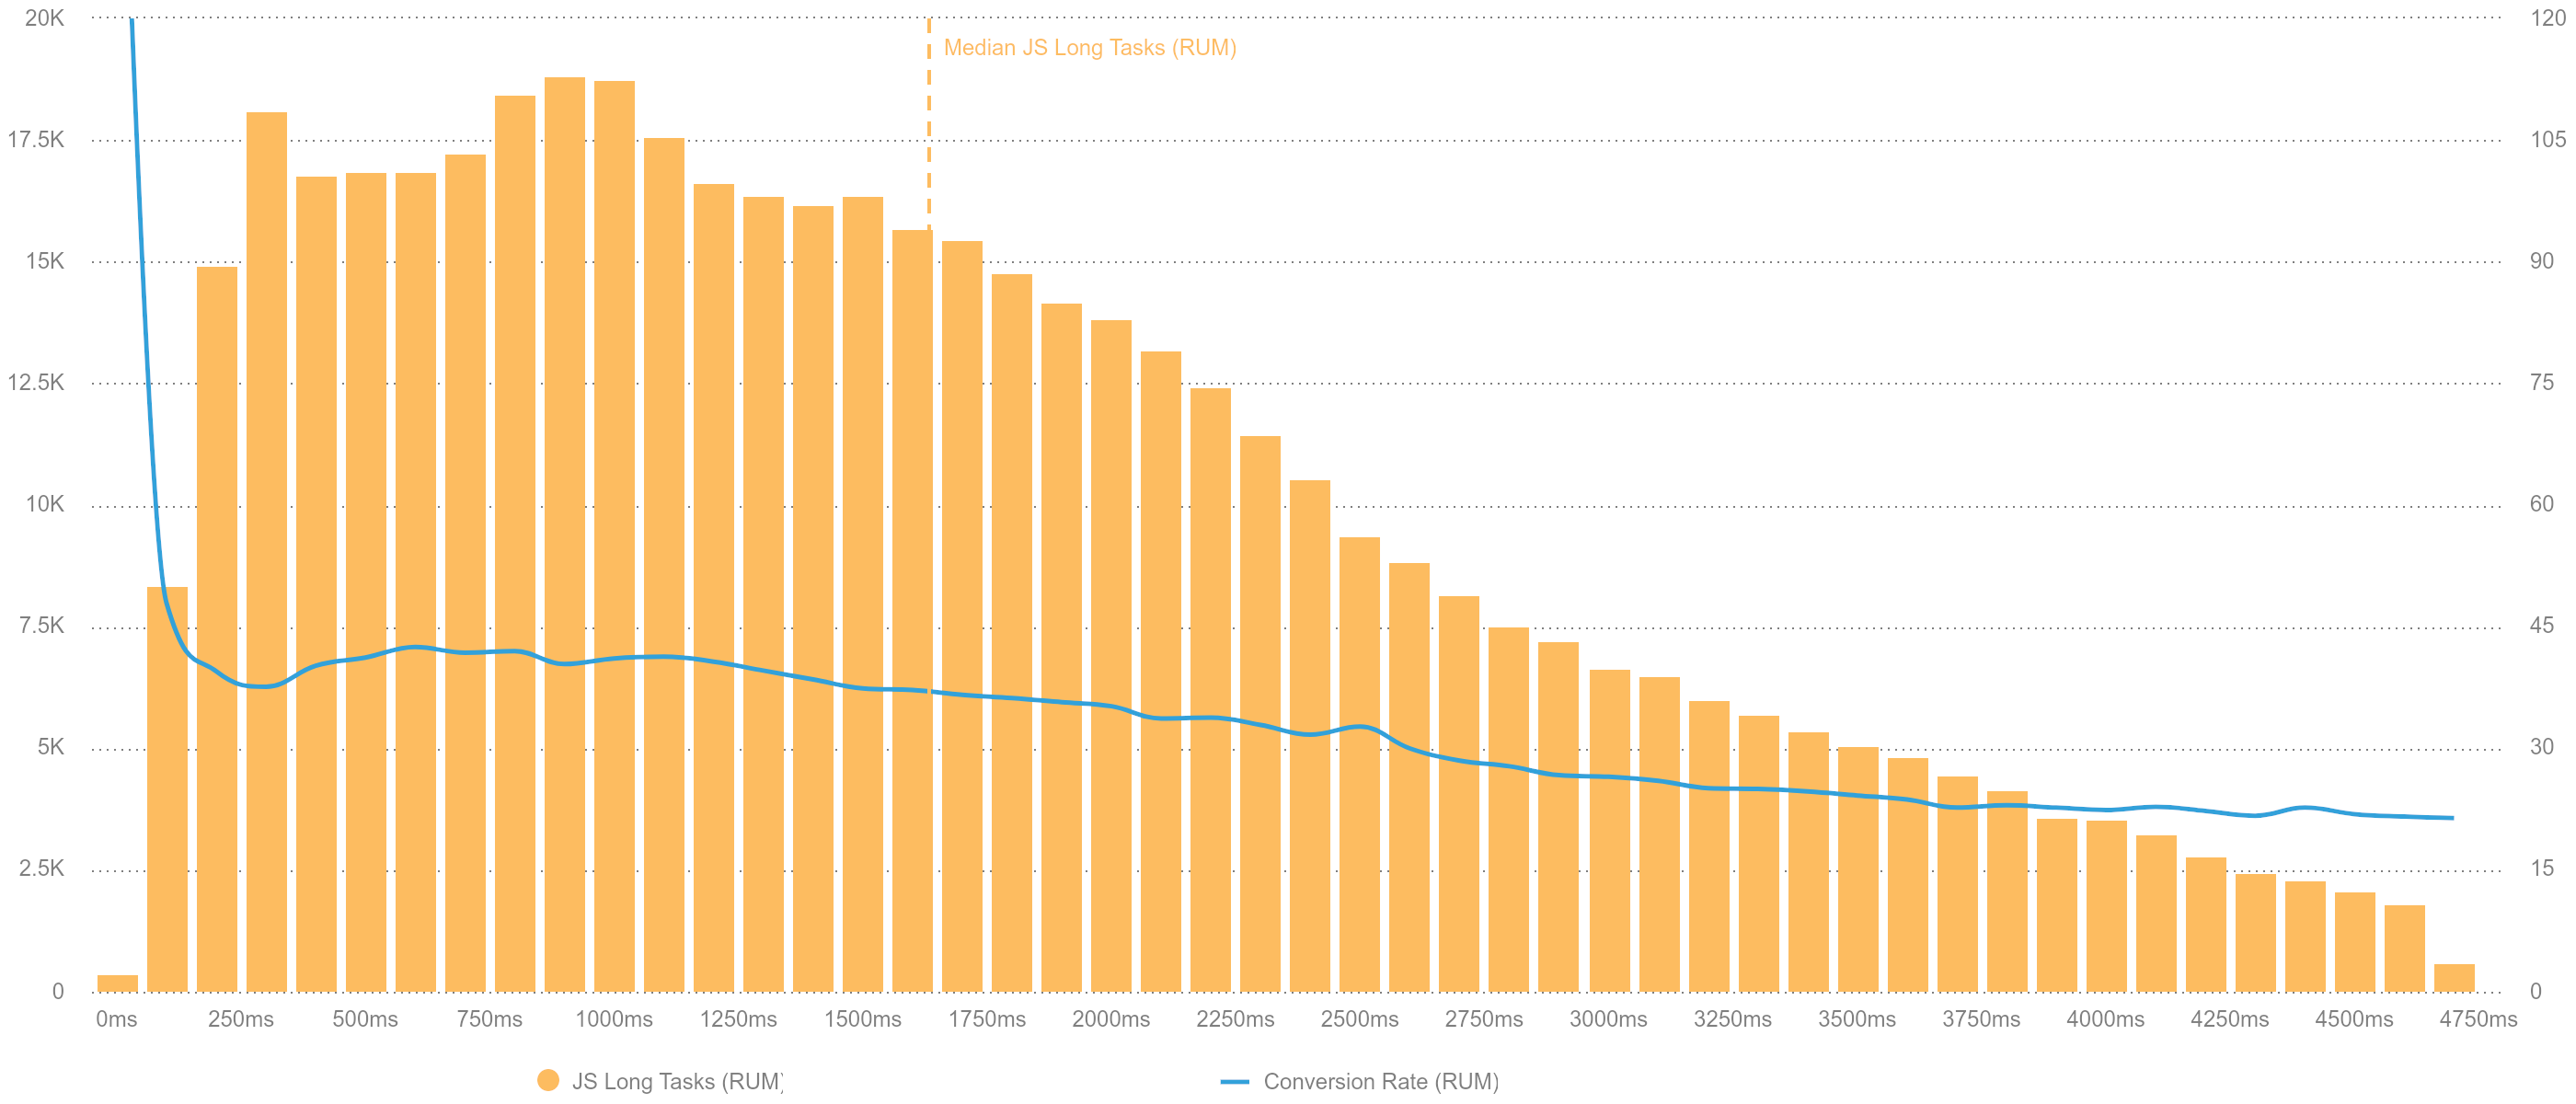
A chart demonstrating a negative correlation between JS Long Tasks and Conversion Rate. The more long tasks, the less likely a user is to convert.
The above chart - taken from RUM data from a client of mine - shows a strong negative correlation between JavaScript long tasks and the conversion rate. The median conversion rate for users that experience < 500ms JS long tasks is 38.5%, while users that experience > 4000ms long tasks have a conversion rate of 11.8%. This has a tremendous business impact and is more strongly correlated than any of the Core Web Vitals!
And with INP 2x more correlated to Total Blocking Time (TBT) than FID, we expect to see a similar negative correlation between INP and the conversion rate.
How do you optimize INP?
As INP is correlated well with TBT, you could imply that reducing TBT will reduce your INP.
- Minimize main-thread work.
- Optimize your JavaScript bundles by code-splitting.
- If you are working on a React app, you should minimize hydration and optimize your rerenders.
- Audit your third parties to ensure they aren’t bloating your main thread on page load or affecting page responsiveness on user interaction, such as event handlers.
Tooling
The best way to measure INP is to collect metrics from real users. If your website meets the criteria to be included in the CrUX dataset, then you can use the CrUX API’s experimental_interaction_to_next_paint field or via BigQuery.

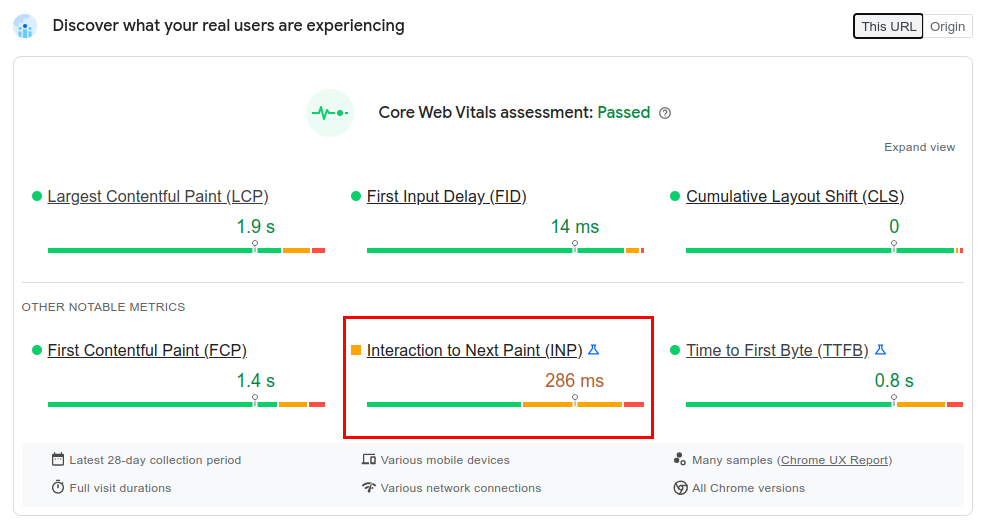
INP is now available on PageSpeed Insights.
You may view INP data using PageSpeed Insights or Treo; however, these still rely on the CrUX dataset.
You can measure the INP metric yourself by using the web-vitals library and sending this data to Google Analytics or another analytics endpoint.
let maxDuration = 0;

new PerformanceObserver(list => {
  for (const entry of list.getEntries()) {
    // Comment this out to show ALL event entry types (useful e.g. on Firefox).
    if (!entry.interactionId) continue;

    if (entry.duration > maxDuration) {
      // New longest Interaction to Next Paint (duration).
      maxDuration = entry.duration;
      console.log(`[INP] duration: ${entry.duration}, type: ${entry.name}`, entry);
    } else {
      // Not the longest Interaction, but uncomment the next line if you still want to see it.
      // console.log(`[Interaction] duration: ${entry.duration}, type: ${entry.name}`, entry);
    }
  }
}).observe({
  type: 'event',
  durationThreshold: 16, // Minimum supported by the spec.
  buffered: true
});
If you’re looking to debug INP on your website, you can create a PerformanceObserver and log the longest interaction. Note that this is a simplification of the INP metric and may vary.
INP in the wild
According to the HTTP Archive, only 56.4% of all mobile origins have a good INP. While 95.7% of desktop origins have a good INP.
| Technology | Origins | Good INP |
|---|---|---|
| ALL | 6,754,899 | 55% |
| jQuery | 5,591,806 | 57% |
| AngularJS | 85,049 | 46% |
| Vue.js | 211,468 | 42% |
| React | 582,000 | 35% |
| Preact | 183,771 | 35% |
| Svelte | 8,062 | 33% |
CWV technology report - INP data for May 2022
The above table is extracted from the HTTP Archive as of May 2022, using the CWV Technology Report. Most modern front-end frameworks do poorly in INP, which isn’t surprising considering how much heavy lifting is being done in JavaScript.
Thank you for reading. I would love to hear your feedback and please reach out if you would like to see more correlations involving INP.
Latest Updates
- On writingThu Jun 26 2025
- Adding a CrUX Vis shortcut to Chrome's address barTue Apr 15 2025
- Contributing to the Web Almanac 2024 Performance chapterMon Nov 25 2024
- Improving Largest Contentful Paint on slower devicesSat Mar 09 2024
- Devfest 2023, MaltaWed Dec 06 2023
