Web Performance Audit
Published: Wed Jun 07 2023Updated: Wednesday July 12 2023
I was asked to perform a performance audit for an online casino operating in Europe. My client noticed that their website is slower than their competitors and they knew that it was costing them millions in lost revenue. This article is an overview of the process, analysis, and recommendations that went into that audit.
My first step when starting a performance audit is to understand the current situation and set up a baseline. Relying on Lighthouse or lab tests alone might not represent what your users are experiencing so I always recommend looking at real user metrics (RUM). For this client, we installed SpeedCurve. Alternatively, you could use the RUM data already available in CrUX.
We then configured some lab tests on WebPageTest. RUM told me that 88% of users are on a mobile device and 99% are on a 4G connection or better. Therefore we set up the lab tests to run on an emulated iPhone X and a Moto G4—using an LTE and 4G connection respectively. We also ran some tests on desktop devices but our main priority was mobile.
In addition to the home page, we also ran tests against other pages that play a critical role in the user journey. The RUM data for these pages was only available in SpeedCurve as the inner pages did not meet the CrUX eligibility criteria.
Largest Contentful Paint (LCP)
The first thing we noted is that the LCP element on the home page is a placeholder image and not representative of the user experience.

If we run the same test but block the above LCP element the LCP increases from the current 1.5s to 4.5s. The new LCP element is the hero image shown on the home page banner. This is much more representative of the user experience and should be the loading experience we should be optimizing for.
To avoid the placeholder image becoming our LCP element we can reduce the size of the image—for example by using CSS for the background color—or reduce the bits-per-pixel to not pass the 0.05 bpp threshold. If either of these is not possible, then it might be worthwhile to add a custom User Timing—for example First Important Paint.
The new LCP image is the 79th requested element. It is a late-discovered resource—such as a CSS background-image or an element added to the DOM using JavaScript. For this client, while the <img> element is present in the initial document, the src attribute is populated using a JavaScript lazy-loading library. Lazy-loading the LCP element is an anti-pattern and can delay rendering.
Cumulative Layout Shift (CLS)
The main contributor to CLS is a UI issue in the slider which appears on the home page.
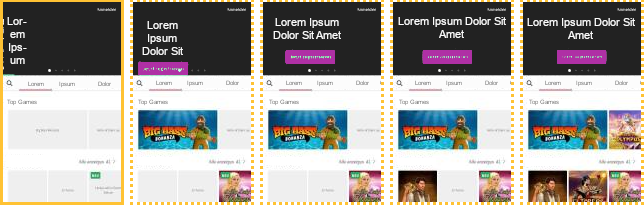
As can be seen in the image above, the width of the content of the slider increases as the first slide transitions into view—starting from 0px until it reaches the full viewport width.
To test my hypothesis, we added width: 100% !important to the .slider-slide CSS selector using WebPageTest experiments, forcing the slider’s contents to always take up the full viewport width rather than transition from 0px. This eliminated the layout shift from the home page banner content resulting in an improvement from 1.20 to 0.17.
The second largest contributor to the CLS score is a layout shift of the footer.
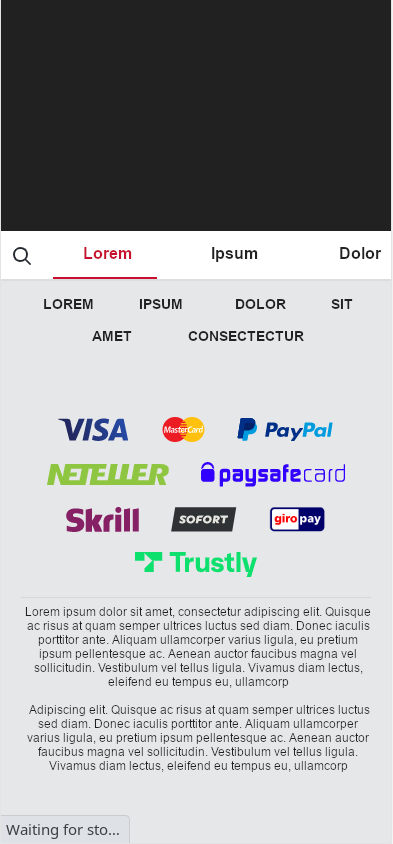
Until the game thumbnails load, the footer is shown within the initial viewport before being pushed downwards and outside of the viewport once the game thumbnails have loaded. If the server-rendered HTML does not include the game data, it may be sensible to reserve the space for the game thumbnails or show skeleton placeholders. In this client’s case, the initial HTML already included the games but they were being removed because of a bug in the hydration phase.
Time to First Byte (TTFB)
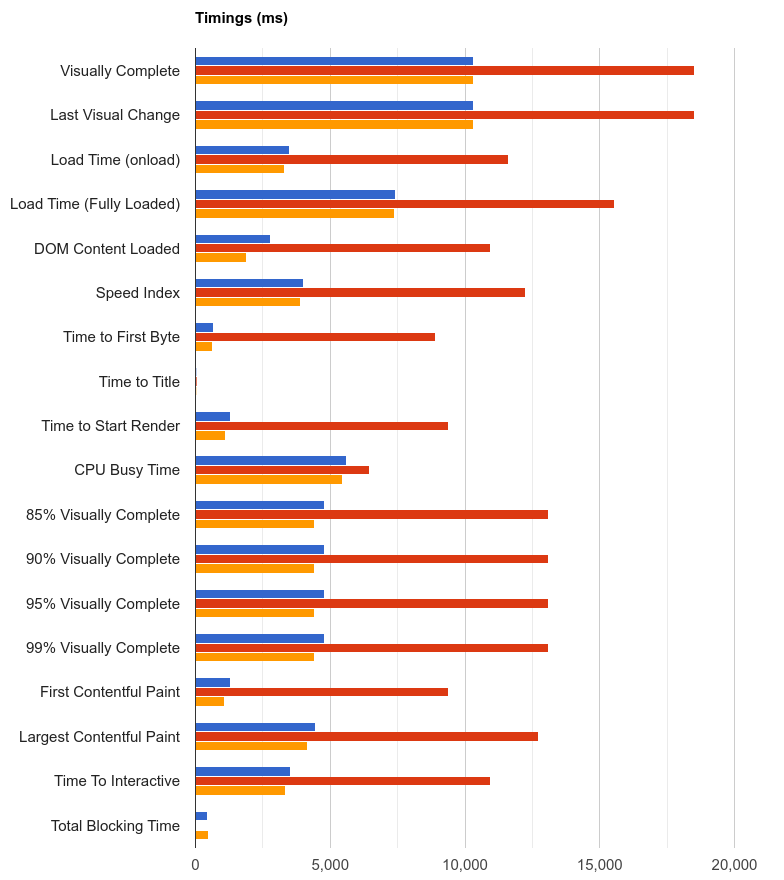
The lab tests for the home page are showing a TTFB of 352ms, while the lab tests for the game page are showing a TTFB of 661ms. These are both much less than the 2.1s recorded by real users on both CrUX and SpeedCurve.
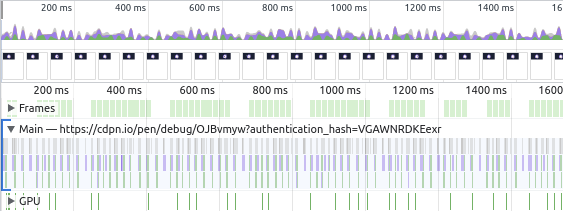
On further investigation and as visible in the chart above, the TTFB of the second run has a terrible 8.9s TTFB—while the first and third tests have a TTFB of approximately 660ms. After a few more tests we were able to confirm that it was not an anomaly and a high TTFB was recorded almost once every four page views. We loaded the page in the browser a few times to check if this only occurs on WebPageTest but sure enough, we experienced a high TTFB within a few refreshes.
I advised the development team to set up monitoring on the server and include server-timing response headers to allow us to correlate the high TTFB with a server process. Based on the latest update I have received from the development team, the high TTFB was caused by cache invalidation on node-cache and will be re-implemented to use a “stale-while-revalidate” strategy.
Document Object Model (DOM)
The home page has a large number of DOM nodes which can affect load time and interactivity.
document.querySelectorAll('*').length; // 3704
After the page has loaded it has a total of 3,704 DOM nodes. It is possible to reduce the number of DOM nodes by flattening a tree structure.
<div class="Description">
  <p>
    <span style="font-size: 20px;">
      <strong
        >The
        <span style="color: #ffe4b5;">Lorem Ipsum</span>
      </strong>
    </span>
  </p>
</div>
If we look at the above HTML structure we are creating 5 DOM nodes to display a short string. This can be refactored to only require two elements without changing its appearance:
<p class="Description" style="font-size:20px; font-weight: bold">
  The <span style="color: #ffe4b5;">Lorem Ipsum</span>
</p>
When deciding which HTML to refactor, you should search for HTML that appears on the page many times. This way any savings will be multiplied by the number of times that the HTML appears on the page.
A good example on this page is the PlayButton <span> element that includes an <svg> element. The same HTML is repeated on each game thumbnail—a total of 238 times. This can be refactored to use an external image in an <img> element or a CSS background-image. Applying a long cache lifetime means that the image will not be downloaded more than once while also improving the user experience for repeat visitors.
JavaScript
The page downloads a lot of JavaScript—a large part of which remains unused at page load. Code-splitting is a common technique to delay the loading of non-critical JavaScript.
The website is developed using React so it is possible to implement code-splitting using React.lazy.
The page also downloads a JavaScript file /static/js/svg-0.js which seems to contain embedded SVGs. JavaScript requires more CPU processing to parse than SVG or HTML, so it may be better to avoid embedding SVGs in JavaScript and instead reference the SVG files as external resources. This client was using webpack so it only required a small alteration to change the loader in the webpack config from svg-url-loader or url-loader to file-loader. Jacob Grob has written a detailed article on this topic.
The page also has a single render-blocking script https://cdn.trackjs.com/agent/v3/latest/t.js that is a third-party resource. Third-party blocking requests are risky as your page’s performance is dependent on the third party’s response time. Can this script be deferred using the defer attribute?
Images
The website uses a JavaScript library for image lazy-loading. We can replace this with the browser’s native image lazy-loading which is available in all major browsers. Additionally, all images are being lazy-loaded, including those in the initial viewport. Only use loading="lazy" for images outside the initial viewport. If you are unsure whether an image would appear in the viewport or not, I recommend that you are cautious and do not lazy-load these images. The browser usually does a good job with resource prioritization.
The page has a large number of images in different formats. WebP is supported on all major browsers and should be the preferred option with a fallback for older formats. The page also includes GIF images that are highly inefficient and should not be used.
The page also features a large number of SVG animations. This is causing two issues. The first issue is that each SVG image includes several Base64 images encoded within the SVG. This results in image files that are larger than their JPEG or WebP equivalent. Additionally, these images cannot be compressed since Base64 is not easily compressed.
Secondly, SVG animations do not run on the compositor thread unless the device has a DPR of 1.0 and the SVG is inlined. This page includes all SVG animations using the <img> tag which causes CPU (and GPU) usage to increase significantly.
Inlining the animations would improve performance on some devices—with a DPR of 1.0—however, most users would not benefit from this and embedding all the animations could significantly bloat the HTML. I would recommend limiting the number of animated SVGs on each page and using CSS transforms when possible.
Finally, we can improve the cacheability of the banner images by increasing the max-age to 31536000 (1 year) since each new banner image gets its unique URL and fingerprint. The same could be done for the favicon and android-icon that currently have a max-age of 200.
Fonts
The three font files are served in the modern WOFF2 format and already use font-subsetting to reduce their size. This is great news as the average font file is only around 15KB. However, they are only cached for 200 seconds. The max-age for all three font files can be increased to 31536000—1 year.
Browser Hints
Fetch Priority API
The Fetch Priority API is supported on Chrome and will soon be enabled on Safari. You can add fetchpriority="high" to prioritize critical assets. Consider adding fetchpriority="high" on the first banner image (the LCP element) and the <script> files.
Preload
The page makes use of some <link rel="preload"> elements to instruct the browser to fetch JavaScript and CSS files. Considering that these files are located in the document <head> and are not late-discovered resources, we can remove the preload for CSS and script files.
Some <script> tags are located before the closing <body> tag. These could be moved to the <head> and the defer attribute added to each of them to make sure that they are not render-blocking.
Preconnect
The page is dependent on the storage.googleapis.com and static.everymatrix.com domains for showing critical content—including the LCP image. Preconnecting to these domains using a <link rel="preconnect"> element can reduce the time it takes to download these resources by opening a connection earlier.
<title>
In most cases, the <title> should be placed as high as possible within the document’s <head> as this gives the user immediate feedback on the content of the page. The <title> element should be placed beneath any <meta charset|http-equiv|viewport> elements. This won’t affect any metrics but it is a good practice to follow.
Legacy code
The page contains some HTML elements specific to Internet Explorer that can be safely removed. This includes an http-equiv="X-UA-Compatible" meta element and a few conditional comments—such as <!--[if lt IE 7]>.
The page also uses an old pattern where the CSS class no-js is added to the <html> element to recognize if the page is interactive—the no-js class is usually removed as soon as JavaScript is executed. However, adding and removing CSS classes to the <html> element causes a Recalculate Style which can slow down the page. This can be safely removed.
Server-side rendering
It is unclear what the intended role of the server-rendered content on the home page is.

The content is hidden behind a splash screen containing the brand logo. By removing the splash screen using another WebPageTest experiment we were able to show the page content much earlier.
If we can fix the URLs and consistently render the page content it could result in a huge improvement. As part of the deliverables I sent to the client, I included a video comparing the experiment that hides the splash screen using CSS display: none with the current loading experience. The experiment is a full second faster to show the game grid and meaningful content.
Going forward
The above document resulted in 21 issues/tasks that were presented to the client. I am in regular contact with the client in case a ticket is not clear or requires further clarification and we have set a three-month timeline to implement most of my recommendations.
Thank you for reading. Please get in touch if you have any questions or feedback.
Disclaimer: The wording of the original document has been modified for a public audience. Any identifiable information, including images, has been modified or removed to protect the client’s privacy. The audit was conducted in May 2023.
Latest Updates
- I got phished!Tue Jun 16 2026
- On writingThu Jun 26 2025
- Adding a CrUX Vis shortcut to Chrome's address barTue Apr 15 2025
- Contributing to the Web Almanac 2024 Performance chapterMon Nov 25 2024
- Improving Largest Contentful Paint on slower devicesSat Mar 09 2024